Project Details

Project Details

Energy, Oil and Gas, Data Saas

Energy, Oil and Gas, Data Saas

. solunar . studio . web . agency

Web & Product Design for Sonaroid Data Analytics

Web & Product Design for Sonaroid Data Analytics

Overview

Sonaroid is a SaaS platform that streamlines access to structured, real-time data and analytics for Africa’s energy sector. It enables consumers to explore rich datasets, reports, and dashboards for better decision-making, while offering contributors a way to share data and earn revenue.

Role

Led the end-to-end product and website design, including research, wireframing, prototyping, and usability testing. Focused on building a user-centered platform experience for consumers, contributors, and administrators.

Challenge

Energy industry stakeholders across Africa lack a reliable, centralized source of structured, real-time data. Consumers struggle to find actionable insights, and contributors have no structured system to share and monetize data. Admins need tools to manage users and maintain data integrity at scale.

Solution

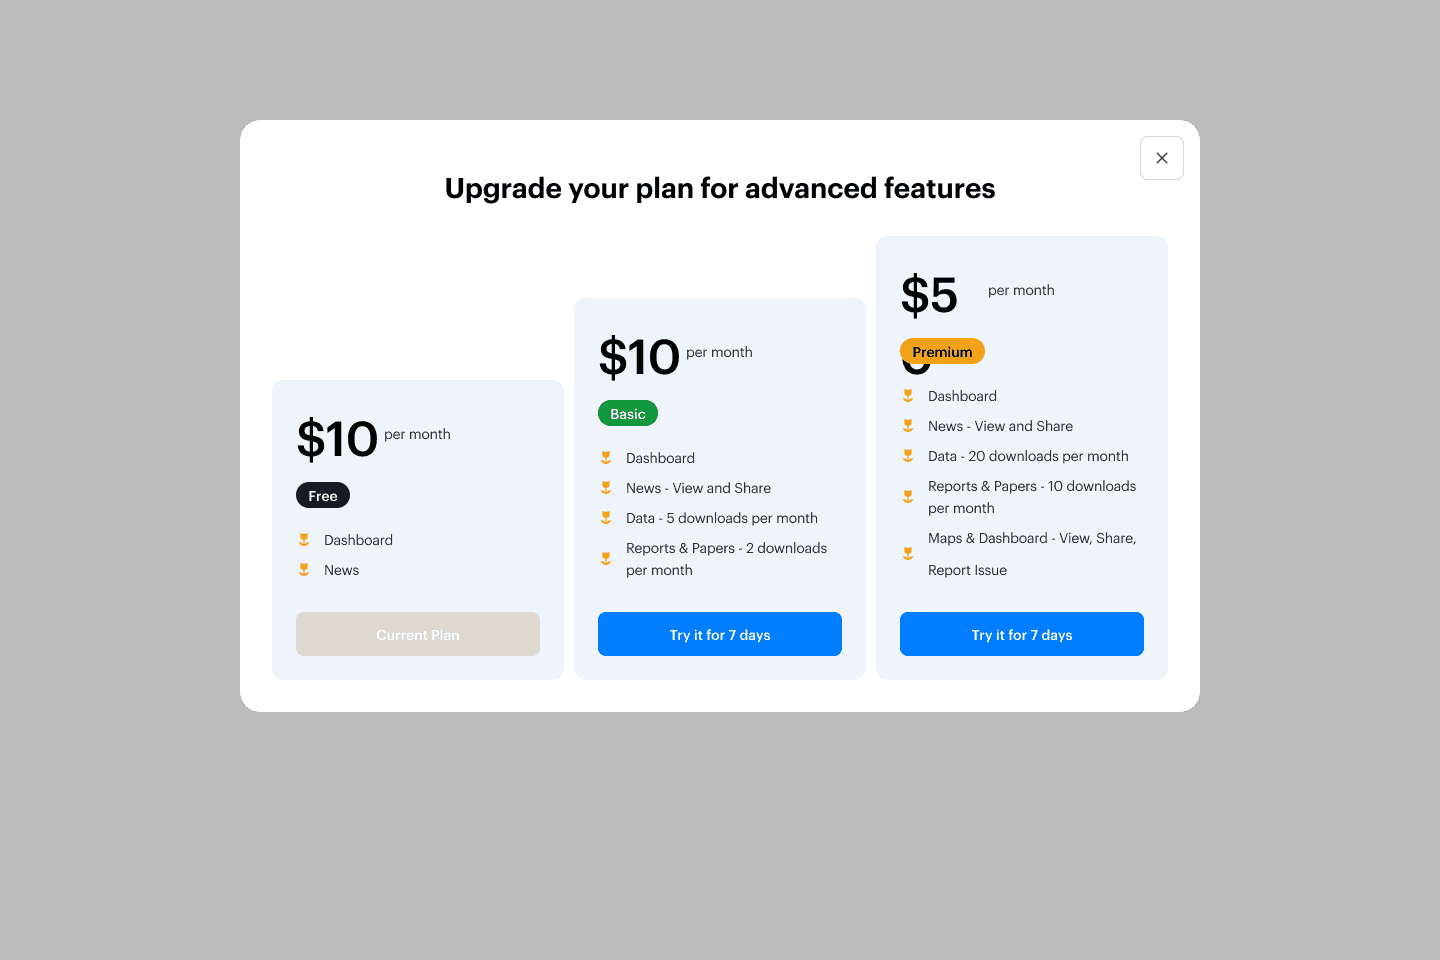
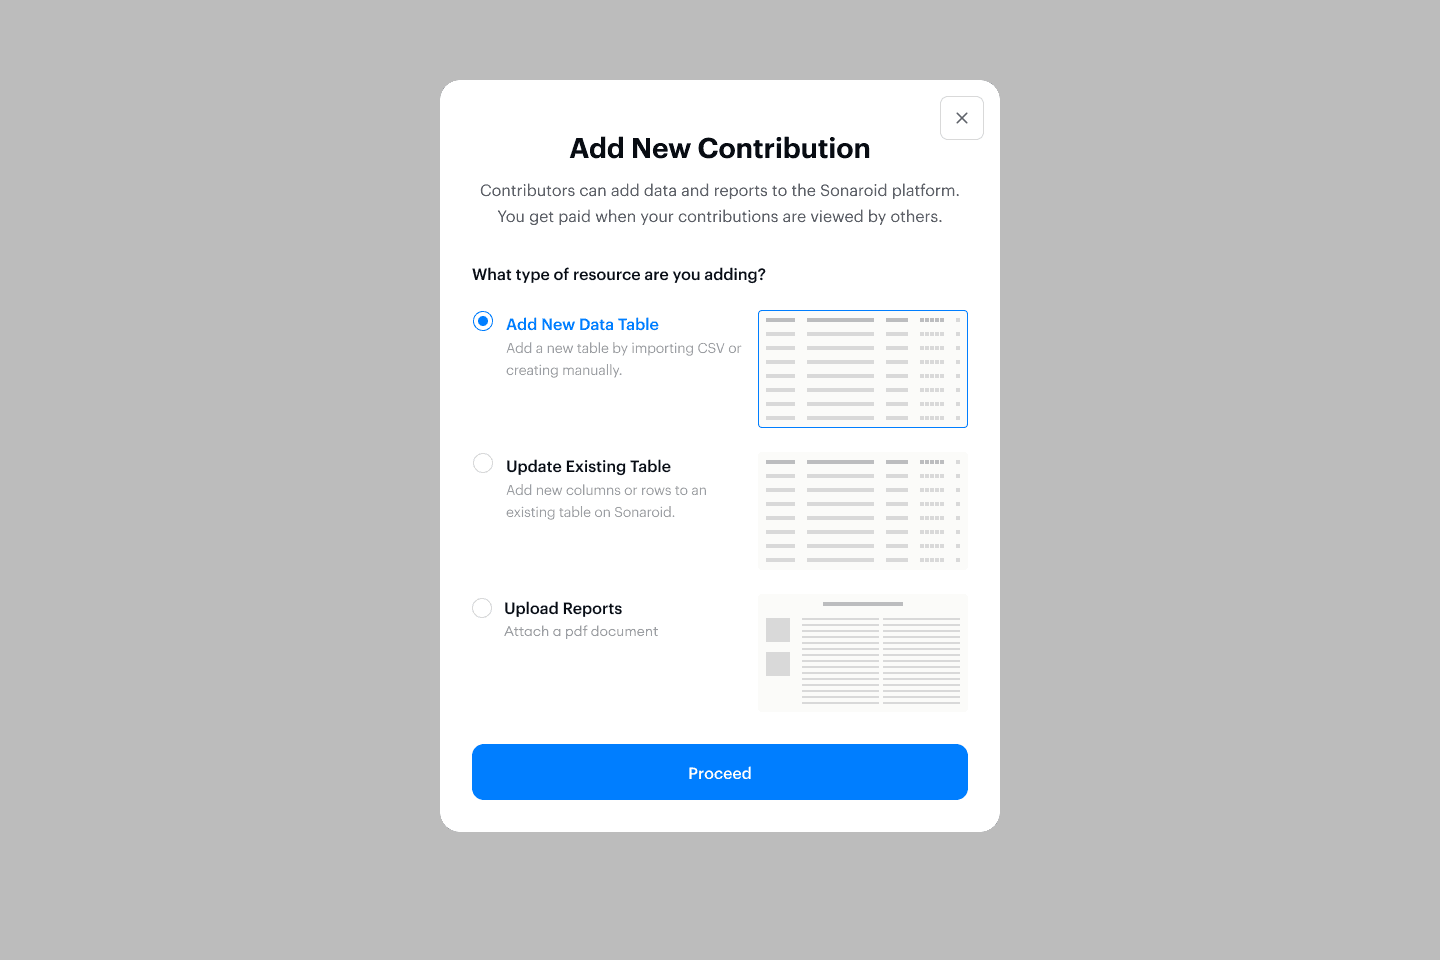
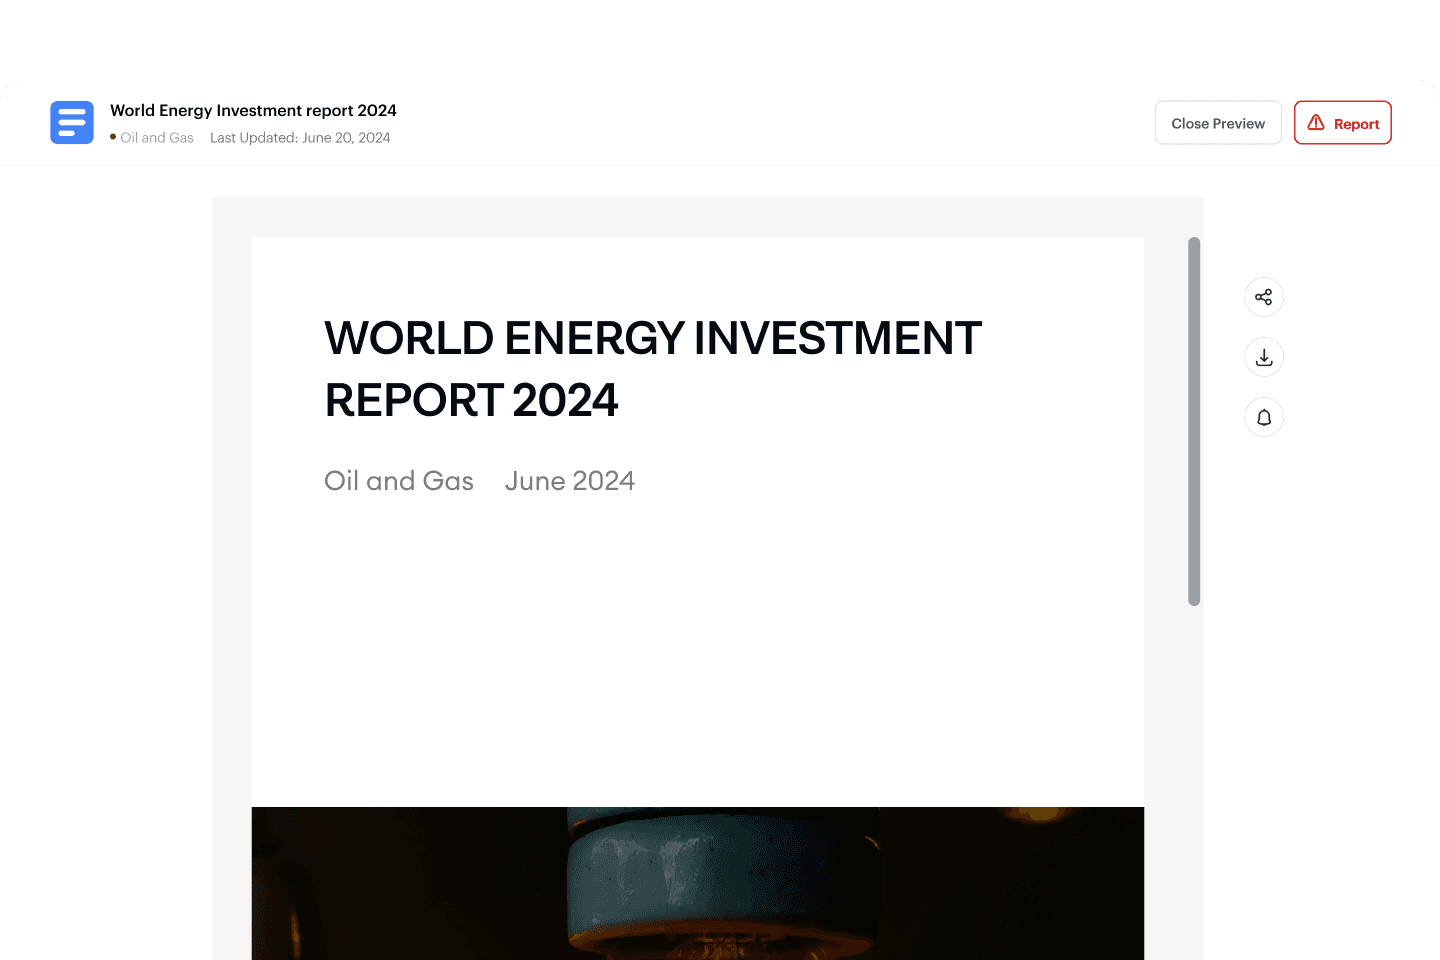
We designed a platform with intuitive onboarding, robust data and report modules, and advanced tools like interactive maps and dashboards. Contributors submit data via a validated workflow and earn through a secure wallet system. Admins use a dedicated interface to monitor usage, approve submissions, and uphold quality standards.

Project details

Client

Sonaroid

Industry

Energy Tech

Location

Lagos, Nigeria

End Date

Project details

Client

Sonaroid

Industry

Energy Tech

Location

Lagos, Nigeria

End Date

Our Process

01
Research & Analysis

This includes conducting user interviews and surveys, as well as analyzing usage data or in-app analytics to identify patterns and bottlenecks. Competitor offerings and industry trends are also reviewed to reveal best practices, feature gaps, and opportunities for differentiation.

02
Information Architecture

Insights from research inform the structure of the experience. Core user journeys are mapped out, key tasks are prioritized, and content is organized into clear sections and flows. The goal is to reduce cognitive load, make navigation intuitive, and ensure that users can quickly find and complete their most important actions.

03
Wireframing & Prototyping

The information architecture then translates into low-fidelity wireframes that explore different layout and interaction options. These wireframes evolve into interactive prototypes that simulate real tasks and scenarios.

04
Usability Testing

Usability testing involves observing real users as they attempt to complete key tasks using the prototypes. Their behaviors, questions, and mistakes reveal friction points and areas of confusion. Feedback from these sessions leads to improvements and a more seamless and intuitive experience.

05
Visual Design & Style Guide

Typography, color, spacing, iconography, and components are defined in a style guide or design system. This ensures consistency across screens and makes it easier for teams to extend and maintain the experience over time.

Tools

Gallery

Ready to turn clicks into customers?

We are one call away to always serve you modern, unique and converting solutions.

Ready to turn clicks into customers?

We are one call away to always serve you modern, unique and converting solutions.

Ready to turn clicks into customers?

We are one call away to always serve you modern, unique and converting solutions.

Create a free website with Framer, the website builder loved by startups, designers and agencies.